Metrics That Matter
A table of raw calls is only useful once you aggregate it into a handful of metrics you actually
watch. The goal is not a wall of dashboards — it is a few numbers that, when they move, tell you
something is wrong before a user complains. Every metric below is a simple GROUP BY over
ops.AiEvaluations.
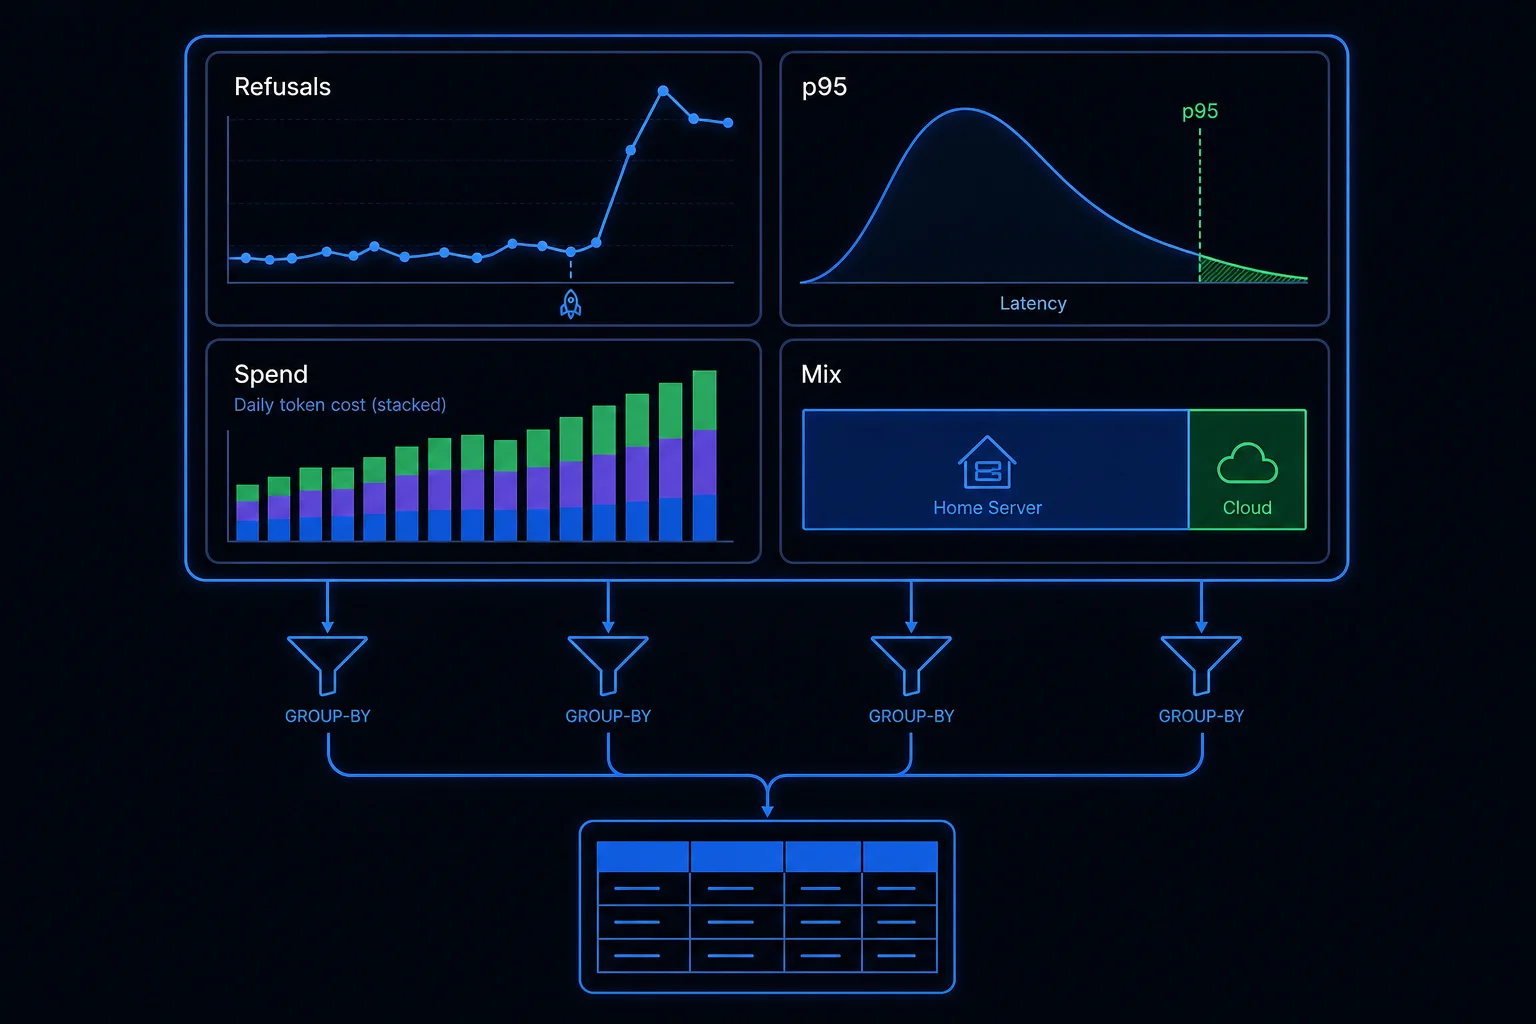
Refusal rate — a quality and knowledge-gap signal
The fraction of calls where Refused = true is the most underrated AI metric. A healthy refusal rate means the system is correctly declining when it lacks evidence — that's the system working as designed. But the trend is what you watch:
- A rising refusal rate often means a content gap — users are asking things your knowledge base doesn't cover yet. That's a backlog of lessons to write, surfaced automatically.
- A sudden spike after a deploy usually means a regression — a broken retrieval step, a changed prompt, a model swap that hurt grounding.
Refusal rate is both a quality gauge and a product-discovery tool. Track it per feature.
p95 latency per provider
Averages hide the pain; p95 latency is what your slowest 5% of users actually feel. Compute it per provider and model, because a local embedding model and a cloud LLM have completely different profiles. Watching p95 per provider lets you:
- Catch a cloud provider degrading without it being masked by fast local calls.
- Decide when a feature should fall back from cloud to local, or vice versa.
- Set realistic timeouts grounded in observed behavior, not guesses.
Token spend per feature, per day
Cost is a first-class operational metric. Summing InputTokens + OutputTokens grouped by feature and day answers "what is the AI costing us, and where?" This is how you find the summarizer that quietly tripled its prompt size, or justify moving a high-volume feature to a cheaper local model.
Local-vs-cloud mix
LyraLearn is local-first: embeddings and many calls run on-box, with cloud reserved for harder generation. The ratio of local to cloud calls — again straight from the Provider column — tells you whether that design is holding. A drift toward cloud means rising cost and latency; a drift toward local may mean quality slipping. The mix is a single number that captures a core architectural promise, and it's worth a place on the dashboard right next to refusal rate, p95, and spend.